Improvement #7 - User Agent View
This is the seventh post in the series 10 improvements in 10 days. Yesterday we improved how dates are shown on elmah.io. Today we cheated a bit and used the occasion to finish a feature that we have been working on for some time.
Since redesigning the message details last year, we've shown informative buttons:
In the example above, elmah.io shows us that the message is generated by Chrome on Windows. While the user icon to the left is clickable, the Browser and Operating system buttons have been informative only. Until now! With todays improvement, clicking one of the buttons will show the new User Agent View:
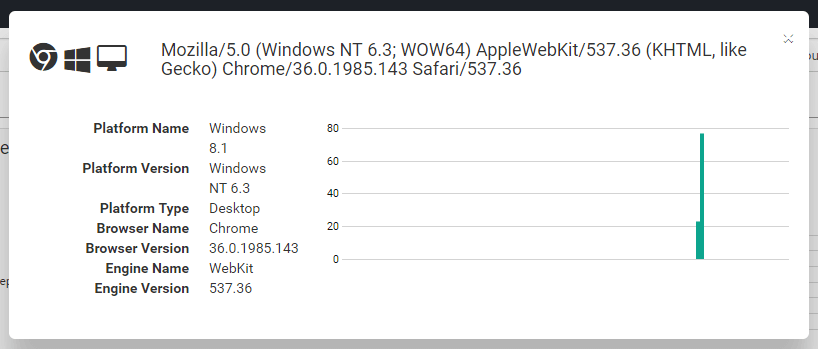
This nice new dialog shows a lot of detailed information about the browser generating this message. Icons in the top left corner tells you that this happened on a desktop Windows Chrome browser. Below, all of the information from the user agent are extracted and shown using friendly names. Finally, to the right you'll see a graph showing how affected your application is from this particular user agent.
elmah.io: Error logging and Uptime Monitoring for your web apps
This blog post is brought to you by elmah.io. elmah.io is error logging, uptime monitoring, deployment tracking, and service heartbeats for your .NET and JavaScript applications. Stop relying on your users to notify you when something is wrong or dig through hundreds of megabytes of log files spread across servers. With elmah.io, we store all of your log messages, notify you through popular channels like email, Slack, and Microsoft Teams, and help you fix errors fast.
See how we can help you monitor your website for crashes Monitor your website